// Resolving cell-type– and region-specific molecular changes in memory-associated brain regions — // integrating single-cell RNA sequencing, Visium HD spatial transcriptomics, and ATAC-seq // in the 5xFAD mouse model of Alzheimer's disease.
// We pair full-transcriptome single-cell profiling with high-resolution spatial mapping to ask how aging and Alzheimer's pathology reshape the molecular landscape of the brain — one cell type and one region at a time.
// Parallel single-cell and spatial pipelines, from probe hybridization to sequencing.
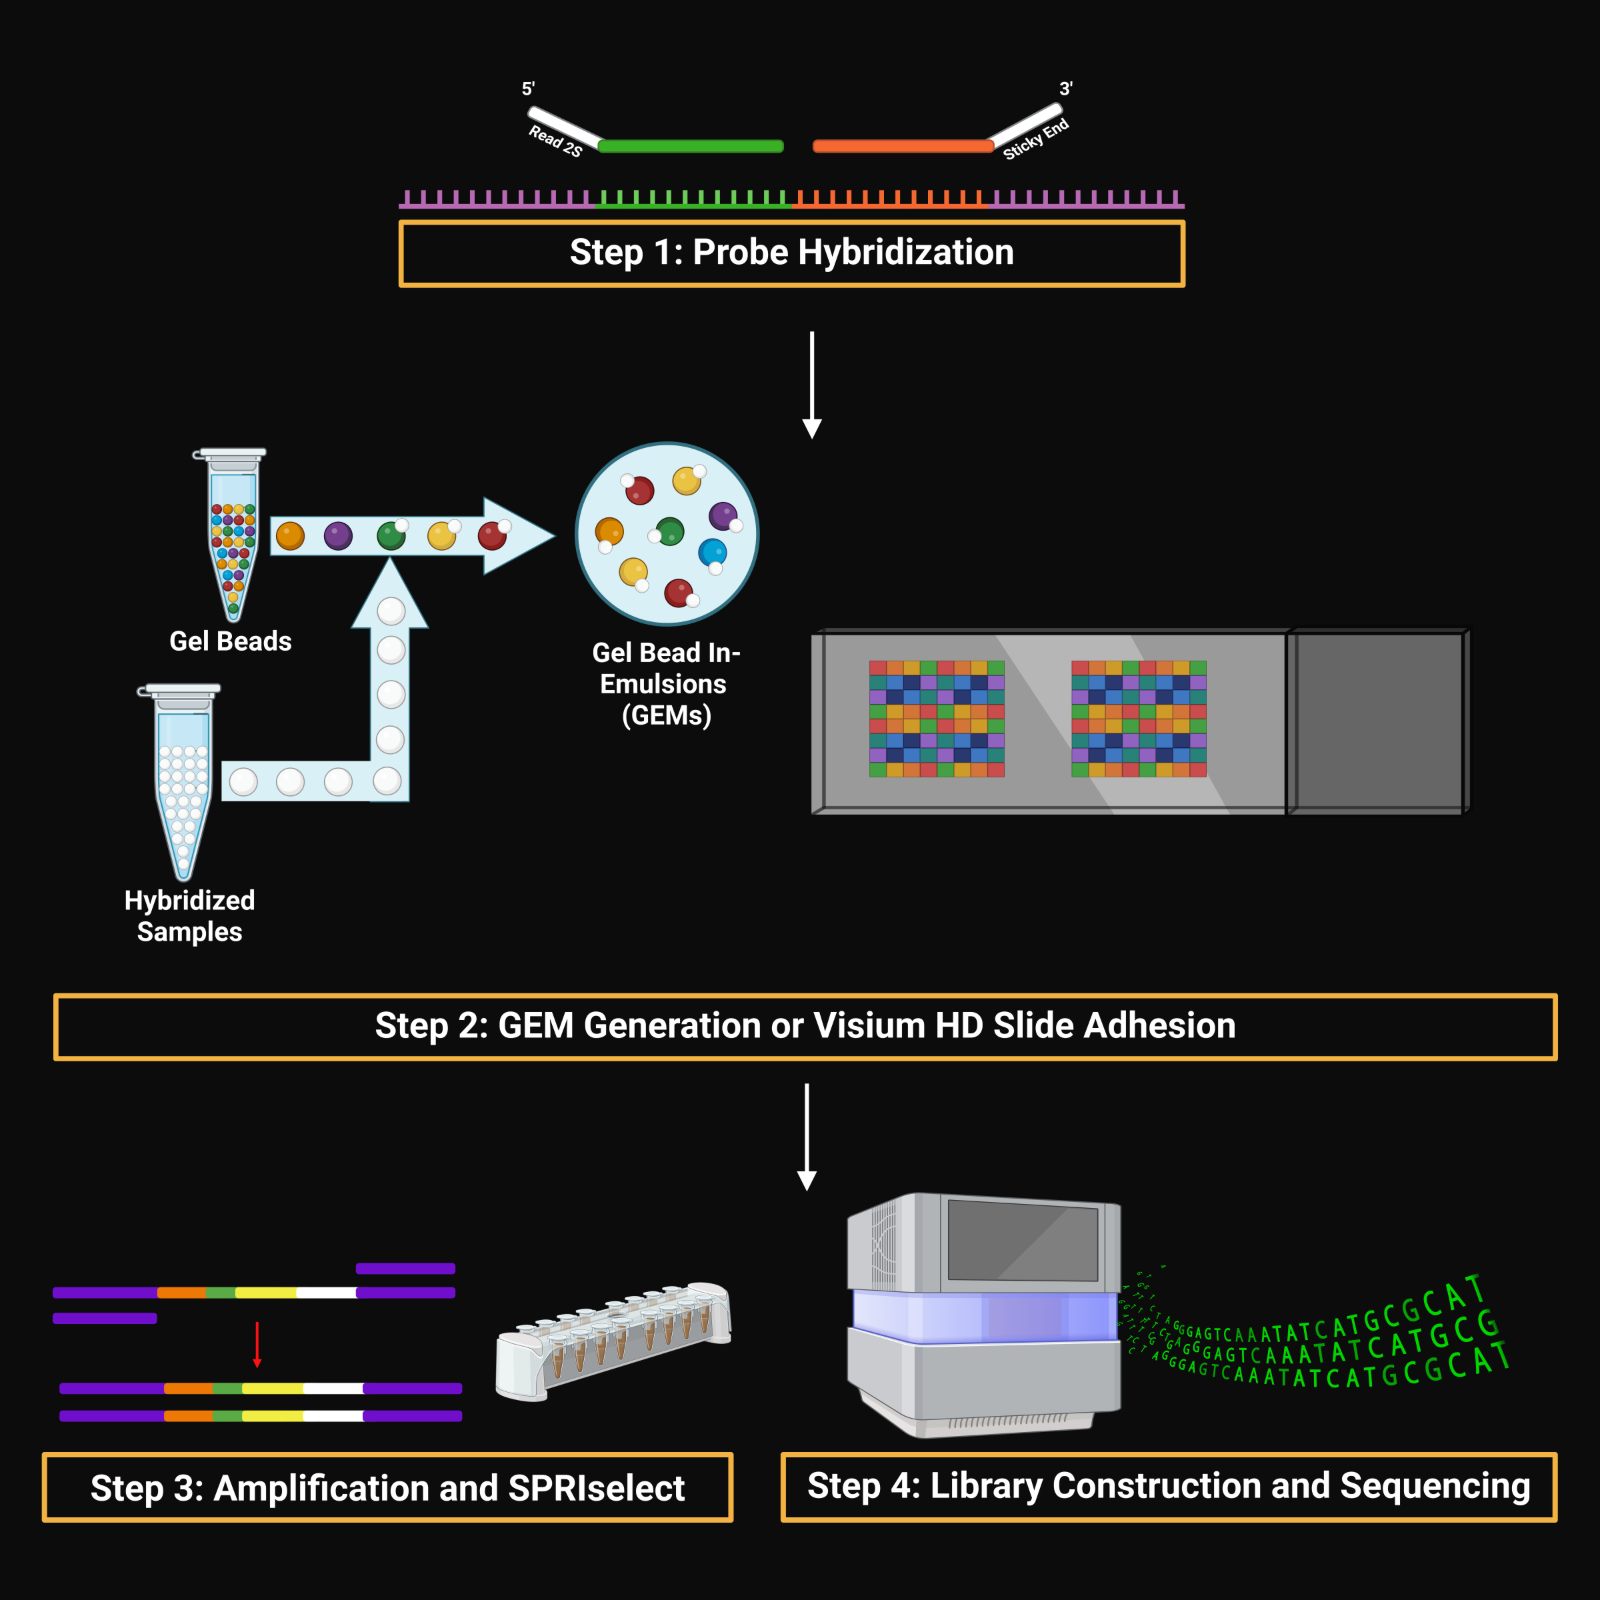
// Figure 1 — Overview of single-cell (Chromium X Fixed RNA Profiling) and spatial (Visium HD) transcriptomics library preparation workflows. Both workflows enable full transcriptome analysis at single-cell resolution, with Visium HD spatial mapping reaching 2µm resolution.
// 80,000 cells resolved into 34 distinct cell types, with disease-driven changes in gene expression across the population.
// Figure 2 — UMAP projection of 80,000 cells and 34 distinct cell-types from mouse brain tissue colored by cell type identity. Each point represents an individual cell and colors denote unique cell type annotations identified by scRNAseq.
// Figure 3 — Volcano plot of differentially expressed genes across cell types identified using scRNAseq. Each point represents a unique gene colored by cell type annotation. Horizontal dotted line denotes FDR significance threshold and vertical dotted lines denote fold change cutoffs. Genes meeting both criteria are considered significantly up- or downregulated.
// Figure 4 — MA plot of differential gene expression. Purple dots represent downregulated genes and orange dots represent upregulated genes. The x-axis represents average gene expression (logCPM) and the y-axis represents log2 fold change (sample 1 vs sample 2). Non-significant genes are shown in gray.
// Figure 5 — Cell type composition across four samples. Each bar represents one sample and is subdivided by the proportional contribution of each cell type (y-axis, percent composition). Colors correspond to the 34 cell type annotations. Differences in composition across samples reflect variation in cellular abundance between conditions.
// ~2.2 million cells mapped in tissue at 2µm resolution, placing molecular change back into anatomical context.
// Figure 6 — UMAP projection of ~2.2 million cells from mouse brain tissue using Visium HD spatial gene expression mapping (2µm resolution), resolving 41 distinct cell-types. UMAP panels are split by sample group, genotype, age, and cell-type to highlight compositional and transcriptional variation across experimental groups.
// Figure 7 — Spatial gene expression map of the top differentially expressed genes identified by scRNAseq analysis. Panels show (left to right): total unique molecular identifier (UMI) counts, average scRNAseq-derived gene expression, and spatially resolved expression of synaptic genes across memory-associated brain regions in a sagittal mouse brain section.
// Figure 10 — Transcript density in a Visium HD tissue section. Warm colors indicate higher transcript abundance, whereas cooler colors indicate lower gene expression levels.
// From differentially expressed genes to enriched biological pathways and altered signaling between cell types.
// Figure 8 — Gene Ontology (GO) analysis showing significantly enriched biological pathways (y-axis) based on differentially expressed genes across cell-type annotations (x-axis).
// Figure 9 — Sankey plot depicting cell–cell communication between sender cell ligands and receiver cell types. Interactions are stratified by sample condition and indicate up- or down-regulated signaling prior to assignment of receiver cell identity.

$ Biomedical Sciences Ph.D. Candidate · Project Lead
// Leads the lab's transcriptomic and epigenomic work on Alzheimer's disease progression — integrating single-cell RNA-seq, Visium HD spatial transcriptomics, and ATAC-seq in the 5xFAD model to find cell-type– and region-specific targets for therapeutic intervention.